

An Analysis of Factors Associated with Goat Production in Selected Areas of Anambra State, Nigeria
by1
Department of Animal Science, Nnamdi Azikiwe University, P.M.B 5025, Awka, Nigeria
*
Correspondence: uc.isaac@unizik.edu.ng
Insights Anim. Sci. 2025, Online First.
https://doi.org/10.69917/ias.02.02-03
Received: June 14, 2025 /
Accepted: September 1, 2025 /
Published online: September 16, 2025
Abstract
This study examined the key factors
influencing goat production in selected local government areas of
Anambra State, Nigeria. A well-structured questionnaire was distributed
to 100 goat farmers randomly selected from the three locations.
Percentage frequency, multiple regression, and chi-square analyses were
employed in data analysis. Results indicated that 64% of the respondents
were male and 36% female. The predominant breeds raised were West
African Dwarf (68%) and Red Sokoto (32%), managed under extensive (50%),
semi-intensive (47%), and intensive (3%) systems. About 70% of the
respondents had no access to credit, and of those who received (30%),
only 7% obtained credit from the bank. A majority (66%) of the
respondents had no access to veterinary services, resulting in
infrequent vaccination (68%) and prevailing Peste des Petits Ruminants
(70%) and foot-and-mouth (25%) diseases. Regression analysis revealed
that the production system significantly influenced farmers' income (R²
= 34.50%, b = 1.04, p < 0.05), while herd size was primarily
affected by production costs (R² = 22.90%, b = 0.26, p <
0.05). Chi-square results indicated that income and production costs
were significantly (p < 0.05) associated with gender and
location of goat farmers. The study concludes that socio-economic
characteristics, breed type, production system, loan access, diseases,
veterinary factors and geographical location are critical determinants
of income and herd size among goat farmers. Prioritizing these factors
is essential for enhancing productivity and economic returns in goat
farming in Anambra State.
Keywords:
Goat farming; health and veterinary factors; production systems; socio-economic characteristics; breed
1. Introduction
The West African Dwarf (WAD) and Red Sokoto (RS) or Maradi goats are
among the predominant goat breeds in Nigeria [1].
These breeds of goat are reared traditionally in different parts of
Nigeria, including Anambra State. Goat farming plays a crucial role in
the agricultural economy of Anambra State, Nigeria. Goat provides meat,
milk, and various by-products, contributing to household income, food
security, and improved nutrition in rural areas. Goat production
enhances human nutrition, and across Africa, goats contribute
approximately 17% of total meat and 12% of milk production [2]. As of 2022, Nigeria was estimated to have a goat
population of approximately 88 million, the highest in Africa [3].
Despite its potential economic importance, goat production in Nigeria
faces several constraints. These include limited access to improved
breeds, reliance on traditional extensive production systems that expose
goats to pests, diseases, and predators, insufficient veterinary
services, and inadequate financial resources [4–6]. Socio-economic factors
such as age, gender, and educational attainment have been shown to
influence goat production outcomes [7]. In addition
to the already known socio-economic or demographic constraints to goat
production, the present study highlights other factors, particularly
geographical location which earlier studies [7–9] did not examine.
The aim of this study was to examine the factors affecting goat
production in selected Local Government Areas (LGAs) of Anambra State
and make recommendations for improvement.
2. Research Methodology
2.1. Study Area
The study was conducted in Ayamelum, Awka North and Orumba North
Local Government Areas of Anambra State, Nigeria. Anambra State is
located in the South-eastern part of Nigeria. The state lies between
Latitudes 5° 32′ and 6°45′N and Longitude 6°43′ and 7° 22′ E [10]. The average daily temperature in Anambra State
is approximately 29 °C. The highest and lowest average temperatures are
33 °C and 24 °C, respectively. The relative humidity and average annual
rainfall of the state are approximately 73.34% and 212.36 mm,
respectively. The wettest month is September with 465.97 mm of rainfall,
and the driest month is December with 15.63 mm of rainfall. The rainfall
pattern in Anambra State is typically tropical and monsoonal. The state
has predominantly Igbo speaking people whose main occupations are
education, farming, skilled work and trading [11].
The map of Anambra state showing the study areas is presented in Figure
1.
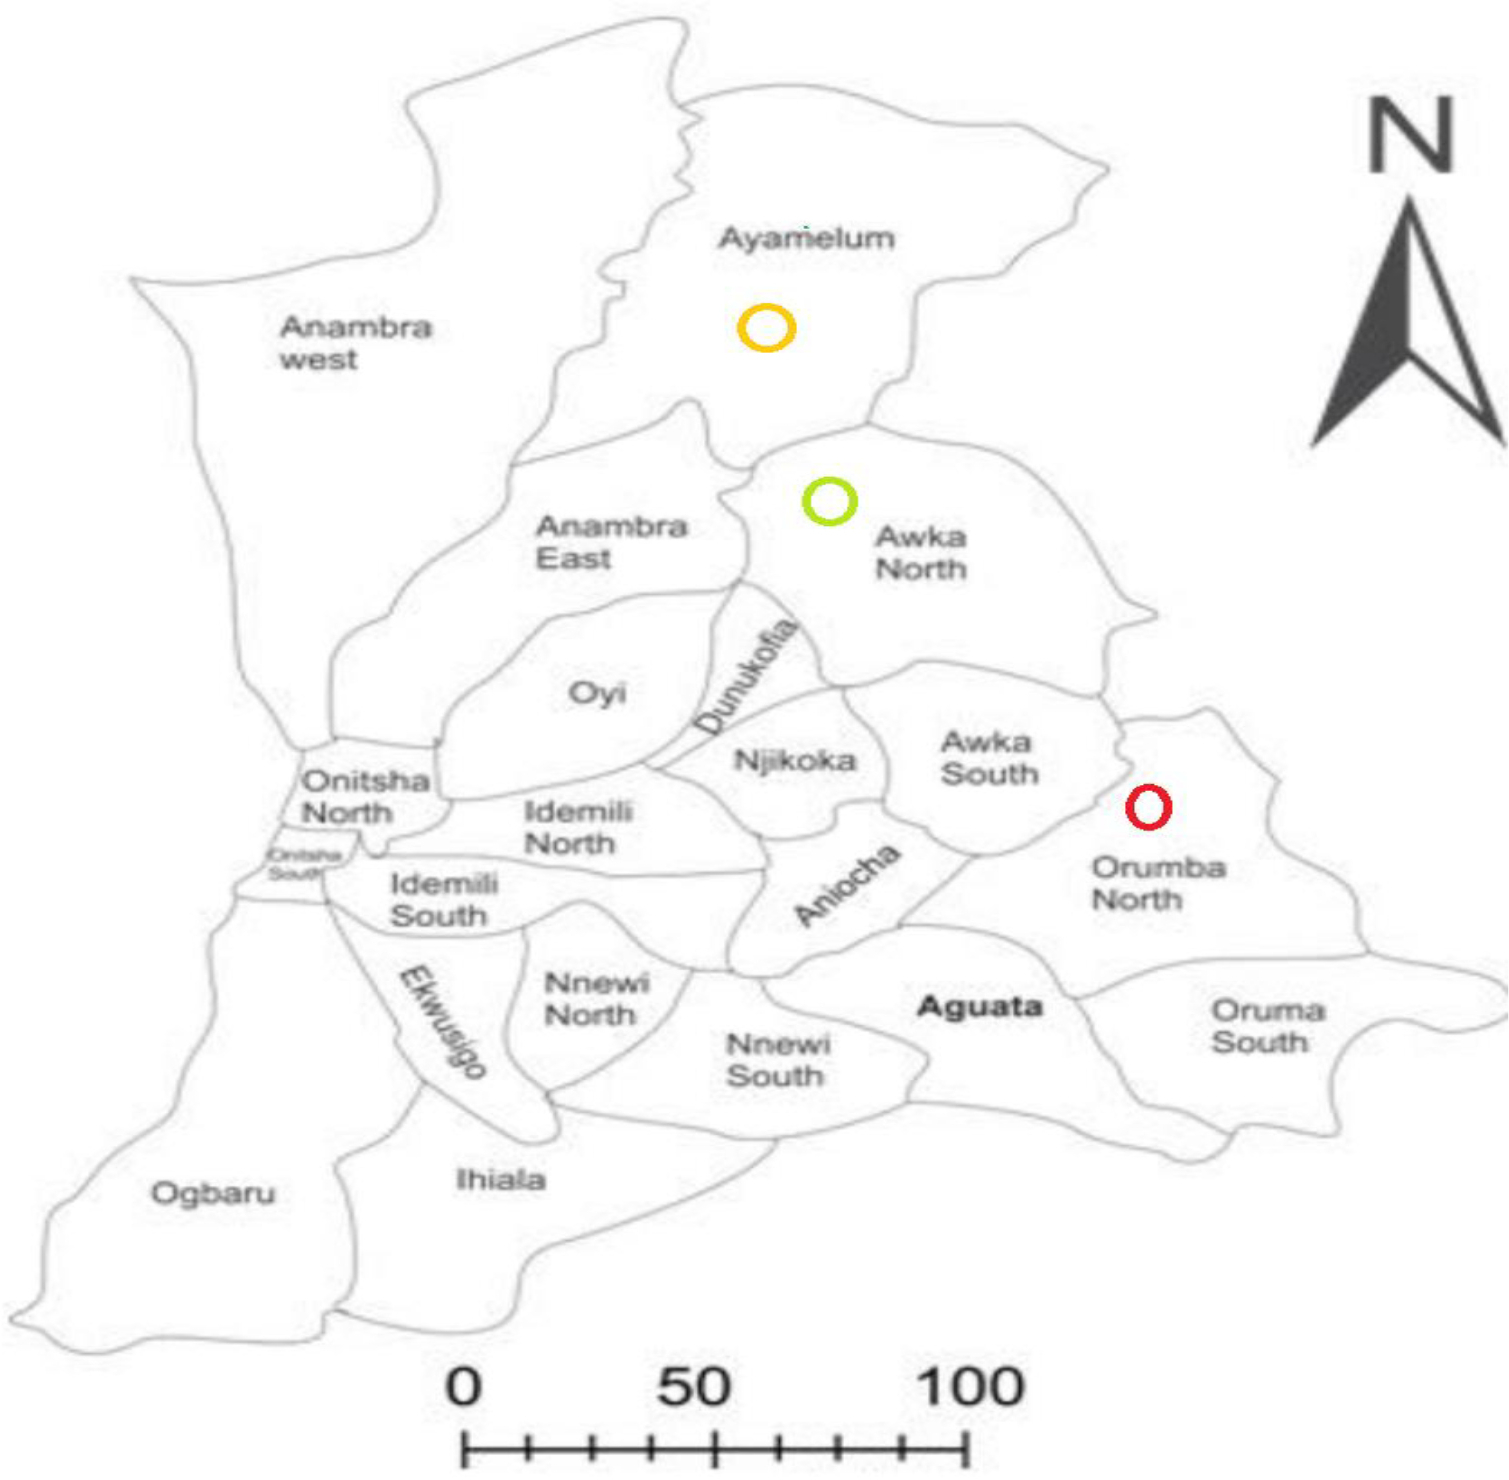
Figure 1. Map of Anambra State showing study
locations.
2.2. Sampling Technique and Data Collection
Well-structured questionnaires were randomly distributed to One
hundred (100) goat farmers in Ayamelum, Awka North and Orumba North LGAs
of Anambra State for the study. These areas were selected due to their
active involvement in goat rearing, abundant land and forage resources,
presence of a viable livestock market, good road network and proximity
to the northern part of Nigeria where there is abundant livestock. The
questionnaires were validated by the lecturers in the Departments of
Animal Science and Agricultural Economics and Extension of Nnamdi Azikwe
University, Awka.
Respondent-based data were collected on gender (X1), age
(X2), level of education (X3), Years of goat
rearing experience (X4), household size (X5), cost
of production in Naira per year (X6), access to loan
(X7), source of loan (X8), access to veterinary
services (X9), diseases affecting goats (X10),
frequency of vaccination (X11), sources of water
(X12), breed of goats reared (X13), production
system (X14), type of feed (X15), location
(X16), number of goats produced or herd size per year
(Y1) and income from goat sales in Naira per year
(Y2).
2.3. Data Analysis
Data were analyzed using percentage frequencies, ordinary least
squares (OLS) regression, and chi-square (χ²) analysis. The OLS
regression has the following model:
| Y = f (X₁, X₂, X₃, …, X₁₆) + εi |
|---|
where Y is the dependent variable, f is the
regression function, and X₁ … X₁₆ are independent variables as
defined earlier. Although herd size and income are related [12], regression analyses were performed for both
variables, as different factors may influence each. For example,
education, experience, or household size may affect herd size, while
access to loans, breed type, and market location may influence income
more directly.
Linear, double-log, semi-log, and log-linear forms of the model were
used for the analysis. These four functional regression models were
selected because they allow for flexibility in functional specification,
enable selection of the best fit model, and facilitate comparison with
previous studies [11]. The regression models are
presented below according to Nwaogwugwu and Udoh [13].
| Linear | Y = β₀ + β₁X₁ + β₂X₂ + … + β₁₆X₁₆ + ε |
| Double-log | lnY = β₀ + β₁lnX₁ + β₂lnX₂ + … + β₁₆lnX₁₆ + ε |
| Semi-log | lnY = β₀ + β₁X₁ + β₂X₂ + β₃X₃ + … + β₁₆X₁₆ + ε |
| Log-linear | Y = β₀ + β₁lnX₁ + β₂lnX₂ + … + β₁₆lnX₁₆ + ε |
where Y is the dependent variable, X₁ … X₁₆ are
explanatory variables, β₀ is the intercept, β₁ … β₁₆
are regression coefficients, and ε is the random error
term.
The models were estimated using ordinary least squares. Model
performance was evaluated using the coefficient of determination (R²),
adjusted R², and F-test for overall significance. Chi-square (χ²) tests
were additionally used where categorical variables were cross-tabulated
to assess dependence or independence between herd size and cost of
production categories. All statistical analyses were carried out using
IBM SPSS Statistics software (version 23, IBM Corp., Armonk, NY,
USA).
3. Results
3.1 Distribution of Goat Farmers Based on their Socio-economic Characteristics
Table 1 shows the socio-economic characteristics of goat farmers in
the study areas of Anambra State. The data reveal that a higher
proportion of goat farmers were male (64%) compared to female (36%).
Most of the farmers (42%) were aged 40 years and above, while 38% were
between 30–39 years, and 20% were within the 20–29 age bracket. In terms
of education, the majority (40%) had attained primary school education.
Regarding farming experience, 38% of the respondents had been involved
in goat farming for 6 to 10 years. The most common household size among
farmers was between 1 and 5 members (41%).
Production costs varied among the respondents. These costs were
largely influenced by the number of goats owned, with notable expenses
directed toward feed and veterinary care. Access to loans was
limited—only 30% of the respondents had obtained any form of financial
support. Of these, 7% accessed loans from banks, 9% from cooperatives,
and 13% from friends or relatives. The remaining 70% of farmers were
self-financed, with no access to formal or informal loan sources.
Forty-four percent (44%) of the goat farmers earned a high income of
₦101,000 and above from goat production, annually whereas 13% earned the
lowest income range of ₦10,000 to ₦50,000.
Table 1. Socio-economic characteristics of goat
farmers in selected areas of Anambra State (N=100).
| Variable | Categories | Percent (%) |
|---|---|---|
| Gender | Male | 64.0 |
| Female | 36.0 | |
| Age | 20-29 years | 20.0 |
| 30-39 years | 38.0 | |
| 40 years and above | 42.0 | |
| Level of education | Primary | 40.0 |
| Secondary | 38.0 | |
| Tertiary | 16.0 | |
| No formal education | 6.0 | |
| Years of experience | 1-5 | 36.0 |
| 6-10 | 38.0 | |
| 11 and above | 26.0 | |
| Household size | 1-5 | 41.0 |
| 6-10 | 37.0 | |
| 11 and above | 22.0 | |
| Cost of goat production, Naira/year/household | 10000-50000 | 47.0 |
| 51000-100000 | 34.0 | |
| 101000 and above | 19.0 | |
| Access to loan (credit) | Yes | 30.0 |
| No | 70.0 | |
| Sources of loan | No loan (Self-funded) | 71.0 |
| Bank | 7.0 | |
| Cooperative | 9.0 | |
| Friends and relatives | 13.0 | |
| Income of goat farmers, Naira per year | 10000-50000 | 13.0 |
| 51000-100000 | 43.0 | |
| 101000 and above | 44.0 |
3.2. Health and Veterinary Factors in Goat Production
Table 2 presents the distribution of the respondents according to
veterinary and health-related factors influencing goat production in
selected areas of Anambra State. The findings reveal that a majority of
the farmers (66%) lacked access to veterinary services. Three major
diseases were identified as affecting the goats, of these, Peste des
Petits Ruminants was the most prevalent (75%). Again, majority of the
farmers (68%) did not vaccinate their goats, while 16% vaccinated them
regularly, and another 16% did so infrequently.
Table 2. Distribution of respondents by
veterinary and health-related factors influencing goat production (N =
100).
| Variables | Categories | Percent (%) |
|---|---|---|
| Access to veterinary services | Yes | 34.0 |
| No | 66.0 | |
| Diseases affecting the goats | Peste de Petits Ruminant (PPR) | 70.0 |
| Foot and mouth disease | 25.0 | |
| Mastitis | 3.0 | |
| Brucellosis | 2.0 | |
| Frequency of vaccination | Regularly | 16.0 |
| Rarely | 16.0 | |
| Never | 68.0 |
3.3 Goat Breeds Reared by Farmers
Table 3 shows the distribution of goat breeds reared by goat farmers
in the selected areas of Anambra State. The findings reveal that 62% of
the farmers reared West African Dwarf (WAD) goats, while 38% reared Red
Sokoto (RS) breeds. Apart from breed type, no other genetic factors were
observed to influence goat production in the areas studied.
Additionally, none of the farmers employed artificial insemination,
estrus synchronization, or other biotechnological methods. This suggests
that goat production in these areas remains largely traditional.
Table 3. Distribution of goat farmers by breed of
goats reared (N=100)
| Breeds of goat reared | Percent (%) |
|---|---|
| West African Dwarf | 62.0 |
| Red Sokoto | 38.0 |
3.4 Distribution of Goat Farmers by Production and Nutritional Factors
Table 4 presents the distribution of goat farmers based on production
and nutritional factors influencing goat rearing in selected areas of
Anambra State. The results indicate that 53% of farmers relied on
boreholes as their water source, 34% used wells, 12% sourced water from
streams, and only 1% used ponds. In terms of herd size, the majority
(60%) kept between 1 to 5 goats, while only 4% maintained herds of 16
goats or more. Regarding feeding practices, 57% of farmers provided
their goats with mixed feed, whereas the smallest group (10%) relied
solely on household waste. The mixed feed constituted a mixture of
household wastes and residues from farm produce. The household wastes
consisted of yam peel, cassava peel, and left-over food, while the farm
waste included rice husk, corn stems and cobs and other similar produce.
As for production systems, 50% of the farmers practiced extensive
rearing, 47% used semi-intensive methods, and only 3% adopted intensive
systems.
Table 4. Distribution of goat farmers by production
and nutritional factors (N = 100).
| Variables | Categories | Percent (%) | ||
|---|---|---|---|---|
| Source of water supply | Stream | 12.0 | ||
| Well | 34.0 | |||
| Borehole | 53.0 | |||
| Pond | 1.0 | |||
| Herd size | 1-5 | 60.0 | ||
| 6-10 | 26.0 | |||
| 11-15 | 10.0 | |||
| 16 and above | 4.0 | |||
| Feed consumed by the goats | Forage only | 13.0 | ||
| Farm waste only | 20.0 | |||
| Household waste only | 10.0 | |||
| Mixed feed | 57.0 | |||
| Production systems | Extensive | 50.0 | ||
| Semi intensive | 47.0 | |||
| Intensive | 3.0 | |||
3.5 Distribution of Goat Farmers by Location
Table 5 shows the distribution of goat farmers by location in the
selected areas of Anambra State. The results indicate that Ayamelum had
the highest proportion of goat farmers (41%), followed by Awka North
with 30%, and Orumba North with 29%.
Table 5. Distribution of goat farmers by location (N
= 100).
| Location | Percent (%) |
|---|---|
| Ayamelum | 41.0 |
| Awka North | 30.0 |
| Orumba North | 29.0 |
3.6 Relationship Between Goat Farmers’ Income and Factors Influencing Production
Table 6 presents the regression analysis of goat farmers' income in
relation to factors influencing goat production in selected areas of
Anambra State. Various regression models were applied, including linear,
double-log, semi-log, and log-linear functions. The preferred model was
selected based on the positivity of regression coefficients (b), the
highest coefficient of determination (R²), and the statistical
significance of the independent variables, as opined by Nwaogwugwu and Udoh [13]. The results identified the linear model as the
lead equation, followed by the semi-log and log-linear models. The R²
values for these models were 34.50%, 31.20%, and 31.10%, respectively.
Each model highlighted different independent variables as having the
strongest influence, but the production system consistently showed the
highest regression coefficients of 0.26 in the linear model and 0.89 in
the semi-log model.
Table 6. Relationship between income of goat farmers
(₦) and factors influencing production.
| Variable | Linear | Double-log | Semi-log | Log-linear | ||||||||
|---|---|---|---|---|---|---|---|---|---|---|---|---|
| Coeff. | Sig. | t-value | Coeff. | Sig. | t-value | Coeff. | Sig. | t-value | Coeff. | Sig. | t- value | |
| Intercept | 2.37 | 3.17 | 0.38 | 4.47 | 2.56 | 7.13 | 0.37 | 2.19 | ||||
| X₁ | -0.15 | 0.31 | -1.02 | -0.08 | 0.60 | -0.73 | -0.52 | 0.31 | -1.02 | -0.03 | 0.48 | -0.72 |
| X₂ | -0.03 | 0.72 | -0.37 | -0.05 | 0.88 | -0.53 | -0.15 | 0.68 | -0.41 | -0.01 | 0.62 | -0.49 |
| X₃ | -0.01 | 0.90 | -0.12 | -0.01 | 0.86 | -0.15 | -0.01 | 0.99 | -0.02 | 0.00 | 0.84 | -0.19 |
| X₄ | 0.01 | 0.94 | 0.80 | 0.02 | 0.05 | 0.18 | 0.04 | 0.92 | 0.11 | 0.00 | 0.95 | 0.07 |
| X₅ | 0.17 | 0.05 | 1.95 | 0.16 | 0.41 | 1.99 | 0.78 | 0.03 | 2.23 | 0.03 | 0.09 | 1.70 |
| X₆ | 0.09 | 0.34 | 0.96 | 0.07 | 0.11 | 0.84 | 0.24 | 0.54 | 0.62 | 0.02 | 0.27 | 1.11 |
| X₇ | -0.44 | 0.23 | -1.21 | -0.35 | 0.02 | -1.59 | -1.31 | 0.18 | -1.35 | -0.13 | 0.12 | -1.56 |
| X₈ | -0.15 | 0.01 | -2.53 | -0.16 | 0.16 | -2.36 | -0.74 | 0.02 | -2.47 | -0.03 | 0.02 | -2.34 |
| X₉ | -0.26 | 0.07 | -1.81 | -0.16 | 0.60 | -1.43 | -0.76 | 0.12 | -1.59 | -0.05 | 0.12 | -1.59 |
| X₁₀ | 0.02 | 0.83 | 0.21 | 0.00 | 0.96 | 0.05 | 0.01 | 0.98 | 0.02 | 0.01 | 0.82 | 0.23 |
| X₁₁ | 0.13 | 0.55 | 0.59 | -0.32 | -1. 13 | 0.02 | 0.24 | 0.42 | 0.52 | 0.05 | 0.35 | 0.94 |
| X₁₂ | -0.05 | 0.59 | -0.55 | 0.15 | 0.38 | 0.88 | 0.46 | 0.54 | 0.61 | -0.02 | 0.48 | -0.71 |
| X₁₃ | 0.20 | 0.28 | 1.09 | -0.06 | 0.50 | -0.68 | -0.22 | 0.59 | -0.54 | 0.04 | 0.32 | 1.00 |
| X₁₄ | 0.25 | 0.04 | 2.05 | 0.18 | 0.20 | 1.29 | 0.89 | 0.14 | 1.48 | 0.04 | 0.12 | 1.58 |
| X₁₅ | 0.04 | 0.60 | 0.53 | 0.09 | 0.28 | 1.09 | 0.33 | 0.36 | 0.92 | 0.01 | 0.43 | 0.79 |
| X₁₆ | 0.10 | 0.19 | 1.32 | 0.08 | 0.30 | 1.04 | 0.38 | 0.26 | 1.15 | 0.02 | 0.25 | 1.16 |
| R2 (%) | 34.50 | 29.00 | 31.20 | 31.10 | ||||||||
| Adj. R2 (%) | 21.90 | 16.30 | 0.19 | 0.18 | ||||||||
| SE | 0.60 | 0.14 | 0.62 | 0.14 | ||||||||
| Overall Sig. | 0.00 | 0.01 | 0.00 | 0.01 | ||||||||
Y = Income from sales of goats in Naira per year, X1 =
gender, X2 = age, X3 = level of education,
X4 = years of experience, X5 =household size,
X6 = cost of production in Naira per year, X7 =
access to loan, X8 = source of loan, X9 = access
to veterinary services, X10 = diseases affecting goats,
X11 =frequency of vaccination, X12 =sources of
water, X13 =breeds of goat, X14 = production
system, X15 =type of feed and X16 =location of the
goat farmers.
3.7 Relationship Between Herd Size and Factors Influencing Goat Production
Table 7 presents the regression analysis of goat herd size in
relation to other factors influencing goat production in selected areas
of Anambra State. The log-linear model emerged as the lead equation,
with an R² value of 22.90% which was statistically significant
(p < 0.05). This was followed by the linear (R² = 21.20%)
and double-log (R² = 19.10%) models. Across the linear (b = 1.04),
double-log (b = 0.66), and semi-log (b = 2.83) models, access to loans
showed a strong positive effect on herd size. Specifically, in the
linear model, one unit increase in access to loans resulted in 1.04 unit
increase in herd size.
Table 7. Relationship between herd size of goat
farmers and factors influencing production
| Variable | Linear | Double-log | Semi-log | Log-linear | ||||||||
|---|---|---|---|---|---|---|---|---|---|---|---|---|
| Coeff. | Sig. | t-value | Coeff. | Sig. | t-value | Coeff. | Sig. | t-value | Coeff. | Sig. | t-value | |
| Intercept | -0.41 | -0.40 | 0.07 | 0.65 | 1.19 | 2.40 | -0.36 | -1.41 | ||||
| X₁ | 0.01 | 0.99 | 0.00 | 0.00 | 0.99 | 0.01 | -0.05 | 0.31 | -0.07 | 0.01 | 0.87 | 0.16 |
| X₂ | 0.16 | 0.17 | 1.38 | 0.11 | 0.37 | 0.89 | 0.66 | 0.68 | 1.28 | 0.03 | 0.32 | 0.99 |
| X₃ | -0.01 | 0.96 | -0.05 | -0.06 | 0.55 | -0.61 | -0.23 | 0.99 | -0.56 | -0.00 | 0.91 | -0.11 |
| X₄ | 0.07 | 0.59 | 0.55 | 0.05 | 0.66 | 0.44 | 0.31 | 0.92 | 0.61 | 0.01 | 0.69 | 0.39 |
| X₅ | 0.04 | 0.77 | 0.29 | 0.00 | 0.99 | 0.02 | 0.04 | 0.03 | 0.08 | 0.03 | 0.36 | 0.92 |
| X₆ | 0.12 | 0.36 | 0.92 | 0.14 | 0.25 | 1.16 | 0.53 | 0.54 | 1.02 | 0.26 | 0.03 | 2.21 |
| X₇ | 1.04 | 0.04 | 2.09 | 0.66 | 0.04 | 2.13 | 2.83 | 0.18 | 2.12 | 0.04 | 0.03 | 2.21 |
| X₈ | 0.13 | 0.11 | 1.62 | 0.18 | 0.06 | 1.91 | 0.62 | 0.02 | 1.49 | 0.03 | 0.37 | 0.91 |
| X₉ | 0.32 | 0.11 | 1.61 | 0.22 | 0.16 | 1.42 | 0.91 | 0.12 | 1.37 | 0.09 | 0.72 | 1.82 |
| X₁₀ | 0.17 | 0.24 | 1.19 | 0.13 | 0.30 | 1.04 | 0.45 | 0.98 | 0.81 | 0.04 | 0.17 | 1.37 |
| X₁₁ | -0.52 | 0.09 | -1.72 | -0.24 | -0.74 | -0.42 | 0.34 | 0.94 | 0.07 | -0.13 | 0.07 | -1.84 |
| X₁₂ | -0.06 | 0.63 | -0.48 | -0.43 | 0.08 | -1.78 | -1.79 | 0.54 | -1.72 | -0.02 | 0.55 | -0.59 |
| X₁₃ | 0.64 | 0.01 | 2.54 | -0.09 | 0.47 | -0.72 | -0.32 | 0.59 | -0.56 | 0.04 | 0.02 | 2.34 |
| X₁₄ | -0.24 | 0.17 | -1.39 | 0.39 | 0.04 | 2.06 | 1.75 | 0.14 | 2.11 | -0.06 | 0.12 | -1.56 |
| X₁₅ | -0.13 | 0.15 | -1.46 | -0.19 | 0.10 | -1.65 | -0.79 | 0.36 | -1.63 | -0.03 | 0.12 | -1.56 |
| X₁₆ | -0.00 | 0.84 | -0.19 | -0.03 | 0.79 | -0.27 | -0.01 | 0.26 | -0.05 | -0.01 | 0.58 | -0.55 |
| R2 (%) | 21.2 | 19.10 | 18.10 | 22.90 | ||||||||
| Adj.R2 (%) | 6.00 | 4.70 | 3.50 | 6.90 | ||||||||
| SE | 0.83 | 0.19 | 0.84 | 0.19 | ||||||||
| Overall Sig. | 0.00 | 0.01 | 0.00 | 0.01 | ||||||||
Y = herd size or number of goats reared by a farmer per year,
X1 = gender, X2 = age, X3 = level of
education, X4 = years of experience, X5 =household
size, X6 = cost of production in Naira per year,
X7 = access to loan, X8 = source of loan,
X9 = access to veterinary services, X10 = diseases
affecting goats, X11 = frequency of vaccination,
X12 =sources of water, X13 =breeds of goat,
X14 = production system, X15 =type of feed and
X16 =location of the goat farmers.
3.8. Relationship Between Herd Size and Factors Influencing Goat Production
Table 8a presents chi-square (χ²) result showing association of herd
size with the gender of the goat farmers. The result showed
that herd size did not depend (p>0.05) on the gender of the goat
farmers. However, by counting, male farmers reared a greater number of
goats than the females in the study areas, the highest was those keeping
1 to 5 goats.
Table 8a. Association of herd size with gender of
goat farmers.
| Herd Size | Male | Female | Total |
|---|---|---|---|
| 1–5 | 37 (38.4) 1 | 23 (21.6) | 60 |
| 6–10 | 17 (16.6) | 9 (9.4) | 26 |
| 11–15 | 6 (6.4) | 4 (3.6) | 10 |
| 16+ | 4 (2.6) | 0 (1.4) | 4 |
| Total | 64 (64.0) | 36 (36.0) | 100 |
Chi-Square Test: χ² = 2.483, df = 3, p = 0.478. 1 Values in parentheses are expected counts.
The results in Table 8b reveal a significant (p < 0.05)
association of goat farmers’ income and their gender. Male farmers
made more income than females in all the categories, with 35 male farmers
made ≥ ₦ 101,000 annually from goat production, while only 9 female
farmers made the same amount annually.Table 8b. Association of income from goat sales with
gender of goat farmers.
| Annual Income from Goat Sales (₦) | Male | Female | Total |
|---|---|---|---|
| 10,000–50,000 | 7 (8.3) | 6 (4.7) | 13 |
| 51,000–100,000 | 22 (27.5) | 21 (15.5) | 43 |
| 101,000 and above | 35 (28.2) | 9 (15.8) | 44 |
| Total | 64 (64.0) | 36 (36.0) | 100 |
Chi-Square Test: χ² = 8.272, df = 2, p =0.016. 1 Values in parentheses are expected counts.
Table 8c presents the χ² result for the association of herd size with
the location of goat farmers. The results indicated that herd size is
significantly (p < 0.05) associated with the location of
goat farmers. Location was, therefore, a significant factor affecting
goat production. In all the herd sizes studied, Ayamelum local
government area has the highest share. This area is far remote from the
city, which encourages farming activities.
Table 8c. Association of herd size with location of
goat farmers.
| Herd Size | Ayamelum | Awka North | Orumba North | Total |
|---|---|---|---|---|
| 1–5 | 27 (24.6) | 14 (18.0) | 19 (17.4) | 60 |
| 6–10 | 11 (10.7) | 8 (7.8) | 7 (7.5) | 26 |
| 11–15 | 3 (4.1) | 5 (3.0) | 2 (2.9) | 10 |
| 16+ | 0 (1.6) | 3 (1.2) | 1 (1.2) | 4 |
| Total | 41 (41.0) | 30 (30.0) | 29 (29.0) | 100 |
Chi-Square Test: χ² = 7.595, df = 6, p =0.269. 1 Values in parentheses are expected counts.
Tables 8d and 8e present the associations of income from goat sales and cost of production with location of goat farmers, respectively.
In both the tables, the χ² analysis indicated significant (p < 0.05) associations of factors.
Table 8d. Association of income from goat sales with
location of goat farmers.
| Annual Income from Goat Sales (₦) | Ayamelum | Awka North | Orumba North | Total |
|---|---|---|---|---|
| 10,000–50,000 | 8 (5.3) | 0 (3.9) | 5 (3.8) | 13 |
| 51,000–100,000 | 21 (17.6) | 8 (12.9) | 14 (12.5) | 43 |
| 101,000 and above | 12 (18.0) | 22 (13.2) | 10 (12.8) | 44 |
| Total | 41 (41.0) | 30 (30.0) | 29 (29.0) | 100 |
Chi-Square Test: χ² = 16.818, df = 4, p = 0.002. 1 Values in parentheses are expected counts.
Table 8e. Association of cost of production with
location of goat farmers.
| Annual Cost of Production (₦) | Ayamelum | Awka North | Orumba North | Total |
|---|---|---|---|---|
| 10,000–50,000 | 24 (19.3) | 6 (14.1) | 17 (13.6) | 47 |
| 51,000–100,000 | 13 (13.9) | 11 (10.2) | 10 (9.9) | 34 |
| 101,000 and above | 4 (7.8) | 13 (5.7) | 2 (5.5) | 19 |
| Total | 41 (41.0) | 30 (30.0) | 29 (29.0) | 100 |
Chi-Square Test: χ² = 20.205, df = 4, p.
< 0.001. 1 Values in parentheses are expected counts.
4. Discussion
The observed higher proportion of male goat farmers compared to
females suggests that men are more actively involved in goat farming.
This aligns with the findings of Nwachukwu and Berekwu [11] in Mbaise,
Imo State, Nigeria, who reported that increased male ownership (86%) and
participation in goat farming reflects greater economic autonomy within
households. Similar observations were made by Adams and Ohene-Yankyera [14]
in Ghana where about 71.5% of respondents were males who engaged in
small ruminant farming, and by Kalu et al. [15] in five states
of South East, Nigeria where 85% of males were reported as owners of
small ruminants.
The predominance of older farmers, as reflected in the age
distribution, suggests that goat production is predominantly undertaken
by mature adults. This finding aligns with Ajala et al. [16],
who observed that age is positively correlated with enhanced
decision-making capacity and the sustainability of livestock farming.
Similarly, Anyanwu et al. [5] reported that older farmers engaged
in sheep and goat farming than the younger ones. The results imply that
many young people tend to pursue alternative business ventures, possibly
due to the perception that goat farming does not yield rapid financial
returns. Furthermore, the educational level data indicate that most
respondents have attained only primary education, which likely limits
their ability to access and apply new knowledge, maintain accurate
records, and adopt innovative practices [17].
The fact that the majority of farmers (38%) have a moderate level of
farming experience (6–10 years) supports the idea that both experience
and education play key roles in shaping production practices, management
strategies, and market access [18]. Household size
distribution suggests that larger families can help reduce labour costs
and boost productivity by engaging family members in farming activities,
consistent with the findings of Young et al. [19]. Results
related to production costs and loan accessibility align with Li et al. [20], who noted that access to credit significantly
influences the adoption of new technologies. In this study, limited
access to loans contributed to low investment levels, reduced
productivity, and the widespread practice of extensive production
systems among respondents. Furthermore, factors such as age, gender,
education level, and access to credit, all of which were observed to
influence goat production in the study area, and these have also been
previously highlighted [7].
The varying levels of annual income from goat production observed in
this study indicate relatively good market access. However, a
significant proportion of goat farmers (65%) lacked access to veterinary
services, which aligned with the findings of Gwaze et al. [21], who
identified inadequate veterinary care as a major constraint to livestock
productivity. The high incidence of Peste des Petits Ruminants (PPR)
recorded in the study areas agrees with the findings of Chukwudi et al.[22], who reported that Anambra State had the
second-highest PPR incidence in a serological survey conducted across
Enugu, Anambra, and Ebonyi States in Southeast, Nigeria. Additionally, other studies
[8,9] confirmed that disease
remains a major challenge for smallholder sheep and goat farmers in
Anambra State. Kadurumba et al. [7] also reported that PPR is a
common sheep and goat disease in Imo State, Southeast, Nigeria, which
further supports the result of the present study. The impacts of PPR and
foot-and-mouth diseases in small ruminants include high morbidity and
mortality rates, slow growth, loss of weight, loss of immunity, high
cost of production through vaccination and control and reduced or lack
of trade in endemic areas [23].
The results obtained on goat breeds suggests that the predominance of
WAD goats is likely due to their natural resistance to trypanosomiasis,
a disease commonly found in the southern part of Nigeria, including
Anambra State. This resistance gives WAD goats a selective advantage
over the RS breed, which lacks trypanotolerance in these areas.
Consequently, WAD goats are more prevalent in the study locations. In
addition, the widespread use of WAD goats in cultural practices and the
local preference for their meat in Anambra State and the broader
south-eastern region [24,25] further contribute to their higher population in
the areas. Nevertheless, the relatively substantial presence of Red
Sokoto goats despite their vulnerability to trypanosomiasis can be
attributed to their domestication in Anambra State [26]. This is likely influenced by the state's
proximity to northern Nigeria, where the RS breed originates, and the
existence of a viable market, particularly in Awka North.
The greater proportion of goat farmers who engaged in extensive
production system corroborates earlier findings by Gefu et al. [27] which described goat farming as predominantly
traditional. This traditional orientation may hinder the adoption of
modern technologies among smallholder farmers. However, these findings
contrast with those of Enwelu et al. [8], who reported a higher
prevalence of intensive management systems among sheep and goat farmers
in the rural communities of Aguata Agricultural Zone, Anambra State.
This discrepancy could be attributed to spatial and temporal variations
in data collection, as well as other context-specific factors.
Furthermore, majority of the respondents (57%) reported using a mixed
feeding strategy, aligning with the observations by Manzi et al. [28], who noted diverse feeding practices among
smallholder livestock keepers. This pattern of feeding suggests that the
study areas benefit from relatively high abundant forage resources and
land availability, facilitating extensive goat production, an assertion
consistent with Obua [29]. Additionally, 60% of
respondents owning a small herd size (1–5 goats), indicated that goat
keeping remains largely a smallholder enterprise. This observation
supports the findings of Nwachukwu and Berekwu [11], who characterized
goat farming in South-eastern Nigeria as a supplementary livelihood
activity rather than a primary income source.
The results of the initial multiple regression analysis suggest that
unidentified factors exerted a substantial influence on farmers’ income.
The positive impact of both the production system and goat breeds on
annual income underscores their importance as key determinants of goat
production. Consistent with previous research, Ishaku et al. [30] documented significant variations in milk fat
content among different goat breeds, while Herrera et al. [31]
demonstrated that production systems can affect growth and overall
productivity in goats. The predominance of male farmers, older age
groups, and limited access to credit, which significantly influenced
income support earlier findings [32]. The
inadequate veterinary support likely contributed to higher mortality
rates and increased financial burdens, as noted earlier [33].
The overall influence of the explanatory variables on herd size among
goat farmers was relatively low. Among these factors, cost of production
exerted the most significant positive effect on the number of goats
reared. Conversely, vaccination frequency, water source, production
system, type of feed, and location demonstrated a negative relationship
with herd size. Most farmers (40%), particularly those from remote
areas, had only primary education (60%) and infrequently vaccinated
their goats. This likely contributed to the predominance of small herds,
with 60% of farmers keeping between 1 and 5 goats. Consequently, the
respondents can be characterized as smallholder goat farmers whose
production barely meets the subsistence needs of their households. This
aligns with the observation that rural peasant farmers often raise goats
primarily for family sustenance and immediate financial needs, rather
than for large-scale commercial purposes [34].
These findings also support those of Ogunniyi [35], who
reported that education, feeding practices, and herd size significantly
affect the economic efficiency of goat production in Ogbomoso, Oyo
State, Nigeria.
Author Contributions: Conceptualization, U.C.I.;
methodology, resources and project administration, U.C.I. and A.F.A.;
formal analysis, U.C.I.; data curation, U.C.I., original draft
preparation, U.C.I. and A.F.A. All authors have read and agreed to the
published version of the manuscript.
Institutional Review Board Statement: Not
Applicable.
Conflicts of Interest: The authors declare
no conflict of interest.
Copyright: © 2025 by the authors.
License: This article is published under the Creative Commons Attribution 4.0 International.CC BY 4.0

Publisher: Insights Academic Publishing (IAP), Lahore, Pakistan.
The findings of this study clearly indicate that enhancing goat
production in the study areas requires a focused effort on improving
feed and water quality, production systems, and the education level of
farmers. Elevating the educational attainment of goat farmers would
empower them to effectively access and utilize veterinary services,
adopt advanced reproductive technologies such as artificial
insemination, heat detection, and oestrus synchronization as advocated
by Dhara et al. [36], as well as maintain accurate
records—practices that are currently lacking. Implementing these
innovations has the potential to transform traditional goat farming into
a modern, commercially viable enterprise by boosting reproductive
efficiency [37]. Additionally, location
significantly influenced goat production, with its positive effects
linked to factors such as land and forage availability, established
traditional farming practices, and the goats’ ability to adapt to
resource-scarce environments [38].
The observed significant association of income with gender, with the
male farmers generating higher earnings from goat farming supports
previous reports [11,39,40]. Furthermore, the significant chi-square
associations between income, production costs, goat breed, and location,
underscore the critical influence of geographical factors on goat
production. Rural localities like Ayamelum and Orumba North
predominantly favour West African Dwarf (WAD) goats, whereas semi-urban
areas such as Awka North tend to rear Red Sokoto goats, benefiting from
better market access and transportation links to northern Nigeria, the
primary source of Red Sokoto breeds. This pattern suggests that
conservation and genetic research focused on pure WAD breeds would be
most effective in remote areas where crossbreeding with Red Sokoto and
other breeds is minimal. These observations are consistent with the
findings of Dhara et al. [41], who reported greater utilization
of indigenous goats in rural regions.
5. Conclusions
This study demonstrates that age, gender, educational attainment,
production costs, access to credit, production system, geographic
location, diseases and availability of veterinary services emerged as
critical determinants of both income and herd size among goat farmers.
These factors constitute major constraints to optimal goat production in
the selected areas of Anambra State. Addressing these multifaceted
challenges is imperative for enhancing productivity and improving the
economic viability of goat farming in the State.
References
- Wheto, M.; Ilori, B. M.; Sanda, A. J.; Adeleke, M. A.; Durosaro, S. O.; Adenaike, A. S.; Adebambo, A. O.; Ikeobi, C. O. N.; Onagbesan, O. M.; Ozoje, M. O.; Adebambo, O. A. Morphological characterization and evaluation of heat tolerance traits in Nigerian goat breeds. Niger. J. Anim. Prod. 2015, 42 (2), 1–13. [Google Scholar] [CrossRef]
- Lebbie, S. H. B. Goats under household conditions. Small Rumin. Res. 2004, 51 (2), 131–136. [Google Scholar] [CrossRef]
- Galal, S. Countries with the largest goat population in Africa 2024. Statista 2024. [URL]
- Girei, M. I.; Ayoola, J. B. Socio-economic factors influencing small ruminant production in Adamawa state; Policy implications for livestock transformation in Nigeria. Int. J. Sci. Eng. Res. 2017, 8 (3), 1261–1272. [Google Scholar]
- Anyanwu, N. J.; Ogualu, J. O.; Odoemelam, V. U.; Kalio, G. A.; Ekpe, I. I. Sheep and goat farming in Imo state Southeast Nigeria: A traditional vocation at the verge of extinction? Niger. J. Anim. Prod. 2020, 47 (4), 237–246. [Google Scholar] [CrossRef]
- Gumindoga, B. N.; Sakwa, L-L. Constraints and opportunities in extensive goat production systems in Agroecological Region V of Buhera and Nkayi districts of Zimbabwe. Int. J. Res. Innov. Appl. Sci. 2024, 9 (5), 395–404. [Google Scholar] [CrossRef]
- Kadurumba, O. E.; Ahiwe, E. U.; Anyanwu, V. C.; Ikpamezie, L. C.; Ahamba, I. S.; Kadurumba, C.; Nwankwo, K. C. Characterization of indigenous goat breeds and their production systems in Anambra State. Niger. J. Anim. Sci. Technol. 2021, 4 (3), 40–51. [Google Scholar]
- Enwelu, I. A.; Ezeuko, E. L.; Machebe, N. S. Challenges of smallholder sheep and goat keeping in rural communities of Aguata Agricultural Zone of Anambra State, Nigeria. Indian J. Anim. Res. 2015, 49 (3), 373–377. [Google Scholar]
- Chah, J. M.; Obi, U. P.; Ndofor-Foleng, H. M. Management practices and perceived training needs of small ruminant farmers in Anambra State, Nigeria. Afr. J. Agric. Res. 2013, 8 (22), 2713–2721. [Google Scholar] [CrossRef]
- Ezenwaji, E.; Abidemi, A.; Otti, V. I.; Eduputa, B. M. Spatial patterns of residential water supply accessibility levels in Anambra State, Nigeria. Int. J. Eng. Res. Appl. 2014, 4 (12), 326–336. [Google Scholar]
- Nwachukwu, C. U.; Berekwu, N. Production and management of goat rearing in rural areas of Ezinihitte Mbaise, Imo State, Nigeria. J. Trop. Agric. Food Environ. Ext. 2020, 19 (3), 25–31. [Google Scholar] [CrossRef]
- Namonje-Kapembwa, T.; Chiwawa, H.; Sitko, N. Analysis of goat production and marketing among smallholder farmers in Zambia. Small Rumin. Res. 2022, 208, 106620. [Google Scholar] [CrossRef]
- Nwaogwugwu, U. C.; Udoh, U. H. The use of SPSS and GenStat computer software in data analysis in agriculture. J. Agric. Food Environ. 2014, 1 (2), 97–109. [Google Scholar]
- Adams, F.; Ohene-Yankyera, K. Determinants of factors that influence small ruminant livestock production decisions in Northern Ghana: Application of Discrete Regression model. J. Biol. Agric. Healthc. 2014, 4 (27), 310–321. [Google Scholar]
- Kalu, U.; Maduka, O. A.; Onuoha, L. U.; Nwachukwu, I. Comparative assessment of the level of utilization of selected improved sheep and goat production technologies in South East, Nigeria. Niger. Agric. J. 2024, 55 (2), 163–169. [Google Scholar]
- Ajala, M. K.; Lamidi, O. S.; Otaru, S. M. Peri-urban small ruminant production in northern Guinea Savanna, Nigeria. Asian J. Anim. Vet. Adv. 2008, 3 (2), 138–146. [Google Scholar]
- Lwoga, E. T.; Ngulube, P.; Stilwell, C. Challenges of managing indigenous knowledge with other knowledge systems for agricultural growth in Sub-Saharan Africa. Libri 2011, 61 (3), 226–238. [Google Scholar] [CrossRef]
- Kosgey, I. S.; Baker, R. L.; Udo, H. M. J.; van Arendonk, J. A. M. Successes and failures of small ruminant breeding programmes in the tropics: a review. Small Rumin. Res. 2006, 61 (1), 13–28. [Google Scholar] [CrossRef]
- Young, J. R.; Evans-Kocinski, S.; Windsor, P. A. Improving smallholder farmer biosecurity in the Mekong region through change management. Transbound. Emerg. Dis. 2015, 62 (5), 491–504. [Google Scholar] [CrossRef]
- Li, J.; Ma, W.; Zhu, H. A systematic literature review of factors influencing the adoption of climate-smart agricultural practices. Mitig. Adapt. Strateg. Glob. Change 2024, 29 (2), 10098. [Google Scholar] [CrossRef]
- Gwaze, F. R.; Chimonyo, M.; Dzama, K. Communal goat production in Southern Africa: a review. Trop. Anim. Health Prod. 2009, 41 (7), 1157–1168. [Google Scholar] [CrossRef]
- Chukwudi, I. C.; Ogbu, K. I.; Nwabueze, A. L.; Olaolu, O. S.; Ugochukwu, E. I.; Chah, K. F. Update on Peste des petits ruminants status in South East Nigeria: serological and farmers’ awareness investigation, and potential risk factors. Trop. Anim. Health Prod. 2020, 52 (6), 3285–3291. [Google Scholar] [CrossRef]
- Aboah, J.; Campbell, Z. A.; Done, M.; Kotchofa, P.; Guy, L.; Wieland, B.; Lo, M. M.; Rich, K. M. Economic impact of peste des petits ruminants on small-scale ruminant production in Senegal: Gender consideration within a system dynamics modelling approach. Agric. Syst. 2024, 217, 103928. [Google Scholar] [CrossRef]
- Gizaw, S.; Komen, H.; Hanote, O.; van Arendonk, J. A. M.; Kemp, S.; Haile, A.; Mwai, O.; Dessie, T. Characterization and conservation of indigenous sheep genetic resources: A practical framework for developing countries. ILRI Research Report No. 27; International Livestock Research Institute: Nairobi, Kenya, 2011. [Google Scholar] [URL]
- Chiejina, S. N.; Behnke, J. M.; Fakae, B. B. Haemonchotolerance in West African Dwarf goats: contribution to sustainable, anthelmintics-free helminth control in traditionally managed Nigerian dwarf goats. Parasite 2015, 22, 7. [Google Scholar] [CrossRef]
- Adamu, H.; Ma’aruf, B. S.; Shuaibu, A.; Umar, H. A.; Maigado, A. I. Morphometric characteristics of Red Sokoto and Sahel goats in Maigatari Local Government Area of Jigawa State. Niger. J. Anim. Prod. 2020, 47 (4), 15–23. [Google Scholar] [CrossRef]
- Gefu, J.; Alawa, C. B. I.; Adu, F.; Magaji, S. O. Characteristics of smallholder sheep and goat management practices in South East Nigeria: observations from Anambra State. Niger. J. Anim. Prod. 1994, 21 (1), 127–134. [Google Scholar] [CrossRef]
- Manzi, M.; Mutabazi, J.; Hirwa, C. D.; Kugonza, D. R. Socio-economic assessment of indigenous goat production system in rural areas of Bugesera District in Rwanda. Livest. Res. Rural Dev. 2013, 25 (11), Article 205. [Google Scholar] [URL]
- Obua, B. E. Feed resources management of smallholder sheep and goat producers in Imo and Enugu states of Southeastern Nigeria. Anim. Prod. Res. Adv. 2008, 4 (3-4), 136–142. [Google Scholar] [CrossRef]
- Ishaku, B.; Ajanwachukwu, N. P. l.; Joan, M. H.; Otaka, A. F.; Taidinda, G. T.; Yohanna, D.; Mngusuur, K. R.; Mohammed, S. U.; Abednego, C. Factors affecting milk yield and milk chemical compositions in Nigerian indigenous goat breeds. Dutse J. Pure Appl. Sci. 2023, 9 (3b), 63–72. [Google Scholar] [CrossRef]
- Herrera, P. Z.; Bermejo, J. V. D.; Henríquez, A. A.; Vallejo, M. E. C.; Costa, R. G. Effects of extensive system versus semi-intensive and intensive systems on growth and carcass quality of dairy kids. Rev. Bras. Zootec. 2011, 40 (11), 2583–2588. [Google Scholar] [CrossRef]
- Bamigboye, F. O.; Oluwasusi, J. O.; Sodiq, A. R. Profitability analysis of goat marketing in Ado Ekiti metropolis, Ekiti State, Nigeria. Niger. J. Anim. Prod. 2021, 44 (3), 178–185. [Google Scholar] [CrossRef]
- Bester, J.; Ramsay, K. A.; Scholtz, M. M. Goat farming in South Africa: Findings of a national livestock survey. Appl. Anim. Husb. Rural Dev. 2010, 3, 9–13. [Google Scholar]
- Kaumbata, W.; Banda, L.; Mészáros, G.; Gondwe, T.; Woodward-Greene, M. J.; Rosen, B. D.; Van Tassell, C. P.; Sölkner, J.; Wurzinger, M. Tangible and intangible benefits of local goats rearing in smallholder farms in Malawi. Small Rumin. Res. 2020, 187, 106095. [Google Scholar] [CrossRef]
- Ogunniyi, L. T. Factors influencing the economic efficiency of goat production in Ogbomoso Agricultural Zone, Oyo State, Nigeria. Anim. Res. Int. 2010, 7 (1), 1129–1133. [Google Scholar]
- Dhara, S.; Thakur, S.; Anwar, S. M. S.; Gupta, M. D.; Sinha, S. Artificial insemination in goat: a new prospect for scientific goat breeding. Anim. Reprod. Update 2023, 3 (2), 1–5. [Google Scholar] [CrossRef]
- Luo, J.; Wang, W.; Sun, S. Research advances in reproduction for dairy goats. Asian-Australas. J. Anim. Sci. 2019, 32 (8), 1284–1295. [Google Scholar] [CrossRef]
- Mahanjana, A. M.; Cronje, P. B. Factors affecting goat production in a communal farming system in the Eastern Cape region of South Africa. S. Afr. J. Anim. Sci. 2000, 30 (2), 149–154. [Google Scholar] [CrossRef]
- Chenyambuga, S. W.; Komwihangilo, D. M.; Jackson, M. Production performance and desirable traits of Small East African goats in semi-arid areas of Central Tanzania. Livest. Res. Rural Dev. 2012, 24 (7), Article 118. [Google Scholar] [URL]
- Aldosari, F. O. Gender participation in sheep and goat farming in Najran, Southern Saudi Arabia. Saudi J. Biol. Sci. 2018, 25 (1), 144–148. [Google Scholar] [CrossRef]
- Khowa, A. A.; Tsvuura, Z.; Slotow, R.; Kraai, M. The utilisation of domestic goats in rural and peri-urban areas of KwaZulu-Natal, South Africa. Trop. Anim. Health Prod. 2023, 55 (3), 204. [Google Scholar] [CrossRef]
Publisher’s Note: The views expressed in all publications, including statements, opinions, and data, are solely those of the individual author(s) and contributor(s) and do not necessarily reflect the views of Insights Academic Publishing (IAP) and/or its editor(s). IAP and/or its editor(s) are not responsible for any injury to persons or damage to property resulting from the ideas, methods, instructions, or products referenced in the content.
Copyright: © 2025 by the authors.
License: This article is published under the Creative Commons Attribution 4.0 International.CC BY 4.0
Publisher: Insights Academic Publishing (IAP), Lahore, Pakistan.